Usage Guide - ScenarioGenerator
Contents
- Introduction
- Menu
- Language Selection
- Chart Menu
- Select Region or Load Scenario
- Energy Demands and Goals
- Forest Wood Scenario
- Wood Ouside Forests Scenario
- SRC Restrictions
- SRC Objectives
- SRC Criteria Weight
- SRC Criteria Scaling
- Base Yields
- Yield Changes
- Base Prices
- Base Costs
- Price Changes
- Cost Changes
- Area Payments
- Interest Rate
- Conversion Factors
Introduction
The ScenarioGenerator is the central component of the BEAST. All other GUIs are available from here. The ScenarioGenerator itself is used to define a scenario for the simulation. By the tree structure on the left side you can decided to which detail you want to modify the default settings.
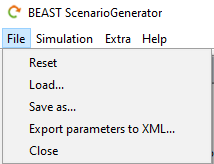
Menu
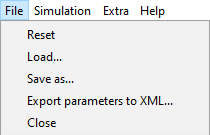
The menu at top of the application frame has four submenus. The first menu, File, provides functionalities to reset the forms (i.e., reload the data from the .beast file), to load a .beast file, to save the form into a new .beast file, to export only the parameters to a separate XML document, and to close the application.
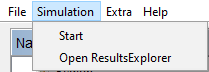
With the second submenu, Simulation, you can start the scenario simulation (the same can be done pushing the Start Simulation button at the bottom of the window). Furthermore, you can open the ResultsExplorer.
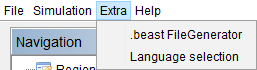
The third submenu, Extra, gives you the opportunity to open the .beast FileGenerator to create a new .beast file as well as to change the language of the GUI. See .beast FileGenerator for details.
Language Selection
From the submenu Extra > Language selection you can open the language selection window. You can choose from the options in the DropDown menu. When pushing the button Apply language selection, the selected language is written to the configuration file. It becomes active after a restart of the programm. It is recommended to restart immediately. Otherwise, mixtures of the languages can occure in the current session.
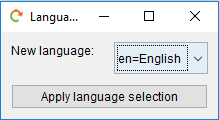
Chart Menu
On all charts, you can open the chart context menu by pressing the right mouse button. You can change the visual appereance of the chart, copy the chart to clipboard, save and print it, as well as change the zoom factor and range.
Select Region or Load Scenario
The first step in starting with the ScenarioGenerator should always be the selection of a region:
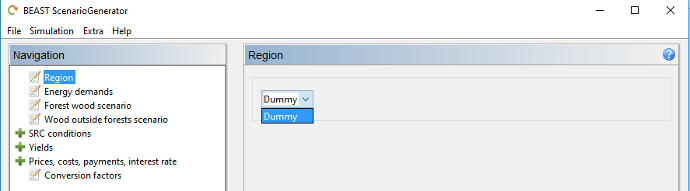
Alternatively, you can load a .beast file via the menu File > Load....
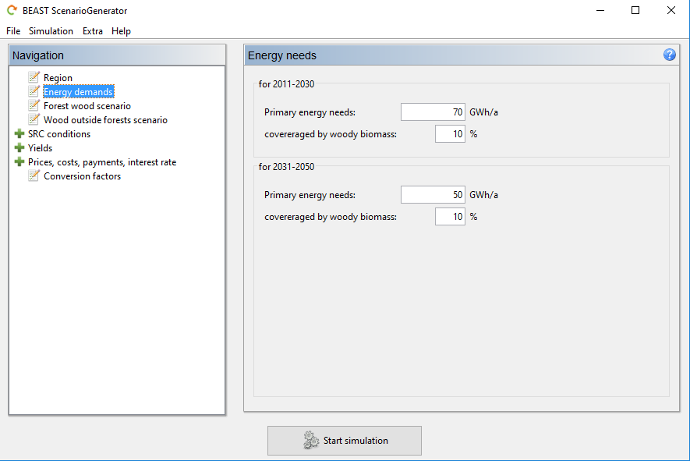
Energy Demands and Goals
In this form the total primary energy needs for the region can be entered for each 20-years simulation period to take efficiency optimization of energy usage over time etc into account. Furthermore, the targeted percentage of this total energy needs covered by woody biomass produced in the region can be entered derived from regional policy of climate protection.
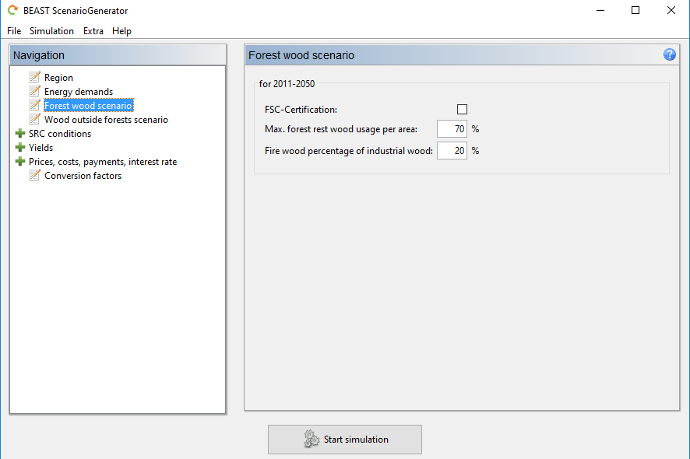
Forest Wood Scenario
Here, the scenario of forest wood usage as bioenergy can be defined.
Should the region be treated under the restrictions of the Forest Stewardship Council (FSC)?
Which amount of the residual wood (not usable as stem or industrial wood) should be exported from the forest for usage as bioenergy? Keep in mind the ecological effects regarding sustainability of using residual wood. If FSC-certification is set to true, no residual wood is available for bioenergy usage.
Which percentage of the industrial wood should be used as fire wood?
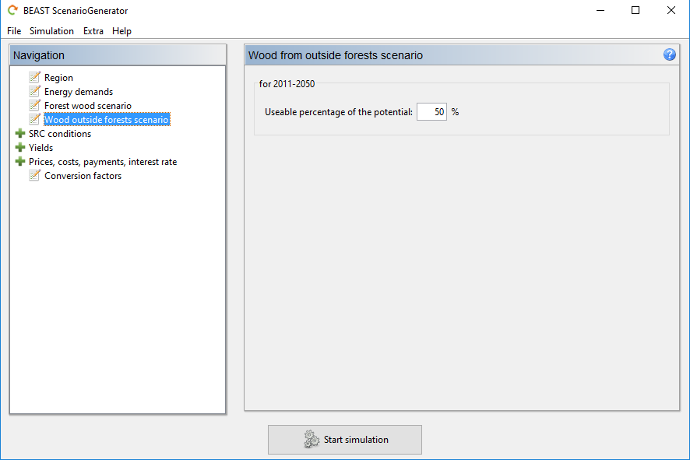
Wood Ouside Forests Scenario
For the usage scenario of wood outside forests (WOF) just the percentage of total biomass potential available for bioenergy usage is defined. Keep in mind that the full potential will nearly never be available. Therefore, 100% should only be used for theoretical scenarios not for realistic scenario calculations.
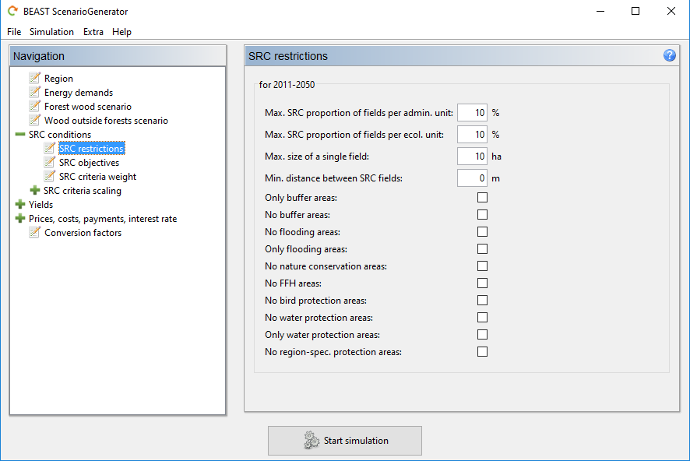
SRC Restrictions
Here, you can specify restrictions for the selection of preference areas for Short Rotation Coppices. With the first two restrictions you can set a threshold of maximal percentage of the arable land for SRCs per administration (e.g., municipalities) or ecological unit. If you do not want to apply such a restriction, set its value to 0 or 100 %.
With the next restriction you can define the maximal area (in hectares) a single preference SRC field should not exceed. If you do not want to apply this restriction set its value to 0 ha.
Be careful in using the minimum distance restriction. Setting this restriction to values > 0 meters activates the functionality.
It takes care that polygons of selected fields for SRC have at least a distance as given to eachother. Therefore, it prevents the building
of large clusters of SRCs consisting of
multiple neighboring fields. However, the selection process is highly iterative because the distance of each field in evalulation has to be checked to all fields already selected.
Thus, it massively slows down the selection process, depending on the number of fields fulfilling the other restrictions.
With the other restrictions you can select, if the potential SRCs fields should be located in specific larger areas (like buffer zones, flooding areas, nature conservation areas etc.) or not.
SRC Objectives
With this form you can specify objetives for the selection of potential SRC fields. They work equivalent to the restrictions. A field is only added to the set of prefered fields, if it fulfills all objectives. To activate the application of an objective, select the checkbox in front of it. For each objective a minimum and/or maximum value can be specified. A field's value has to be above the minimum value and/or below the maximum value to be considered for the further selection process.
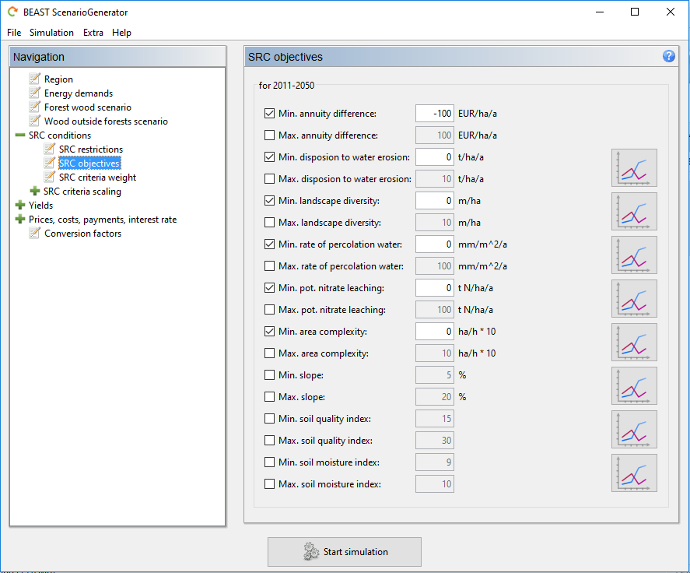
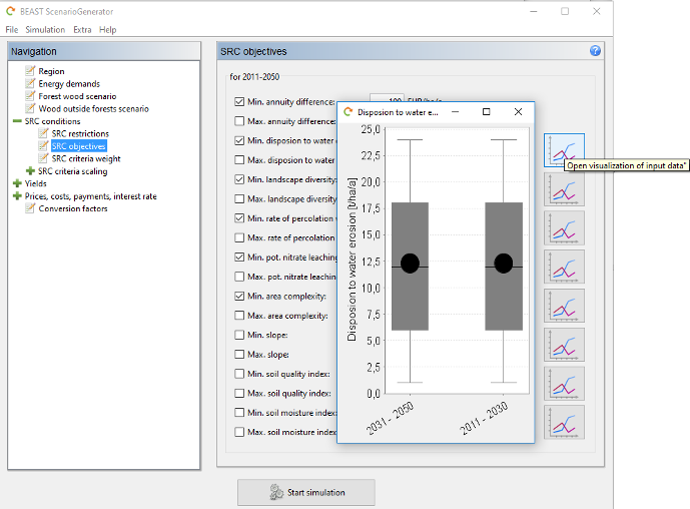
Except the annuity difference, which is calculated during the scenario simulation, you can visualize the value range of the different variables of the input data by pressing the graph button on the right of each objective. A boxplot visualizing the input data for the simulation periods is opened and delivers an impression of reasonable objective values.
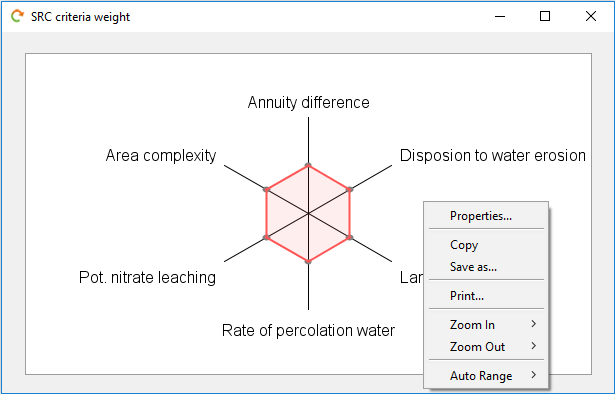
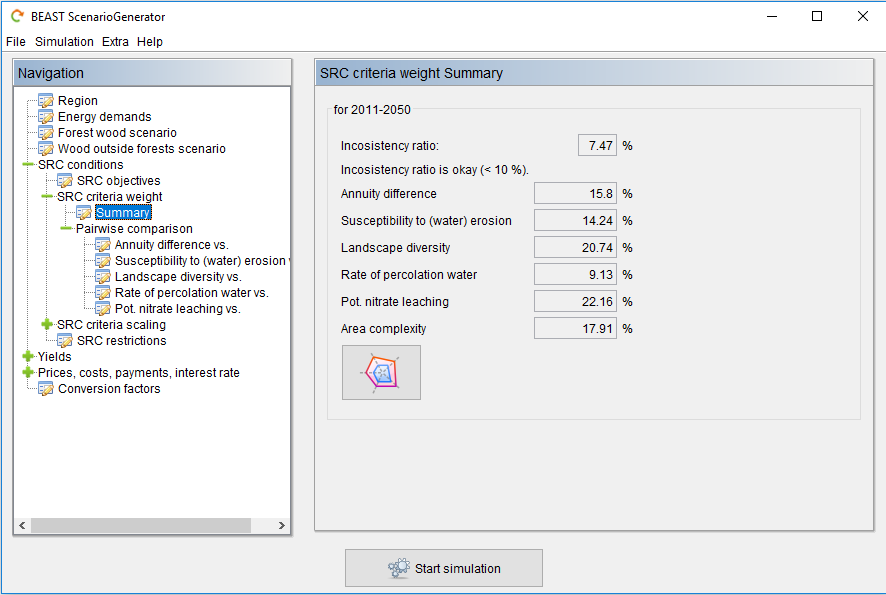
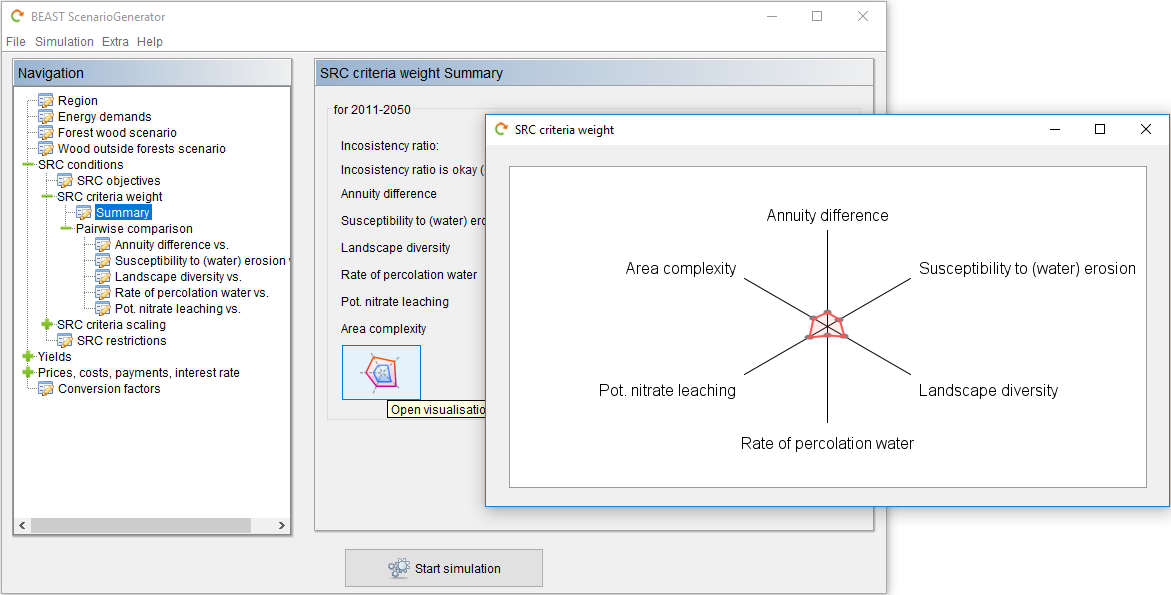
SRC Criteria Weight
For the selection order of preference fields as well as for the suitability classification multiple criteria are applied for the calculation of a (scaled) criteria sum. To calculate this sum the different criteria are weighted. The weight is calculated by using Saaty's Analytical Hierchary Process (AHP). For information on AHP method see, e.g., here.
The summary form shows the criteria weights for the different criteria as a result of the pairwise comparisons of the Analytical Hierarchy Process. On top is the inconsistency ratio. This ratio should be lower than 10 %. Otherwise, inconsistencies exist in the pairwise comparisons which should be corrected.
On the different pairwise comparison forms to importance of a criterium over another one is chosen. The slider is used to select the strength of the importance.
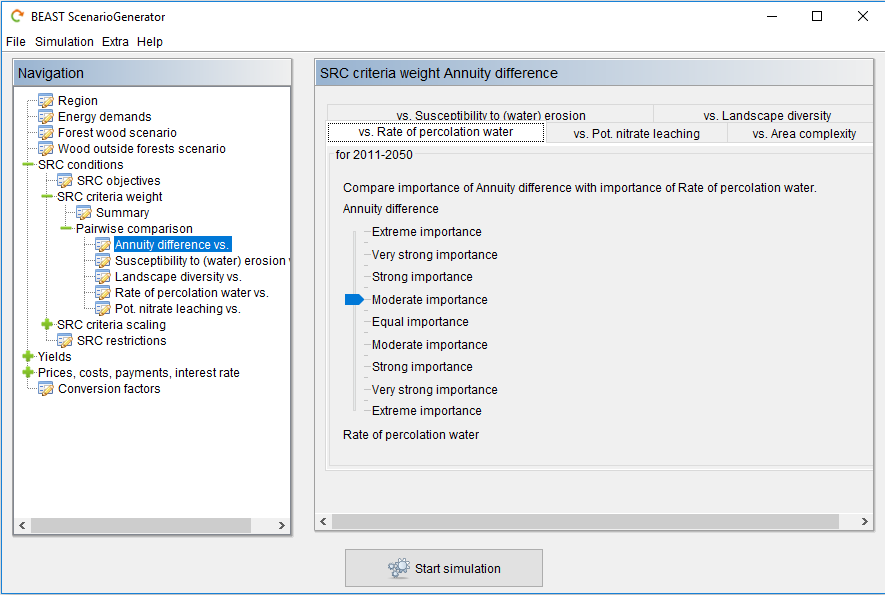
Pushing the button below the slider gives you a vizualization of your criteria weighting in a spider graph. It delivers a visual impression of your preferences. The larger the coloured area for a criterion the higher its weight.
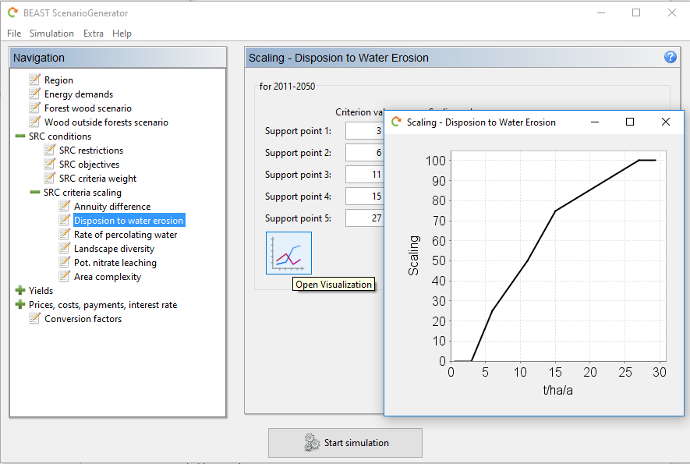
SRC Criteria Scaling
For the different criteria a definition of what is a high and what is a low value has to be given. This is done with the criteria scaling. For each criterion you can deliver five supporting points by giving the combination of criterion and scaling value. Scaling values should be between 0 and 100. 0 represents a low criterion value and 100 a very high.
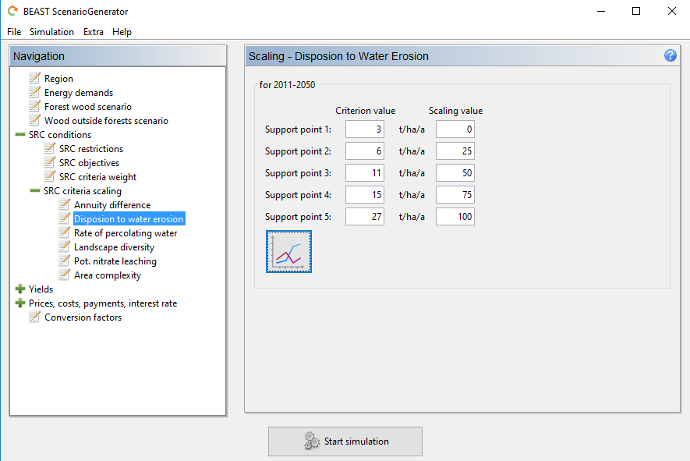
By pushing the button below the input form you get a vizualization of your mapping between the criterion and scaling values in a linegraph.
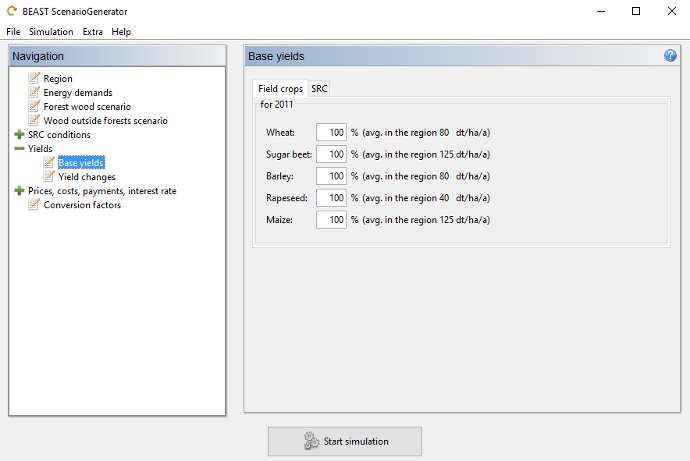
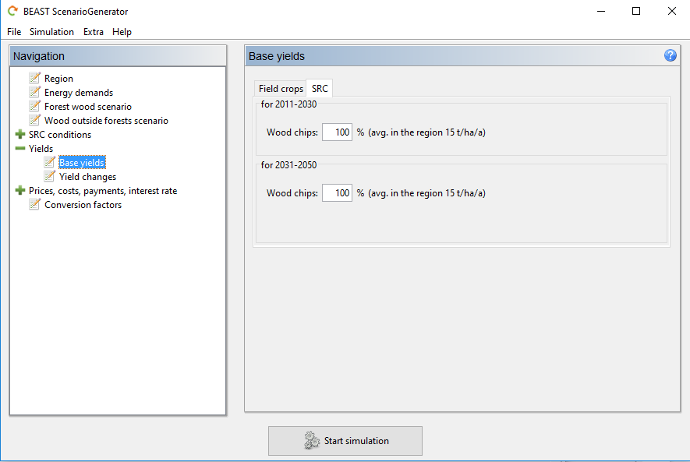
Base Yields
In this form, you find the average base yields of the different field crops stored in the input data and used for the scenario simulation (look for "(avg. in the region ...)"). You are able to modify the base yields by inserting values different to 100%. The percentage value is applied to each field seperately. Therefore, you are able to decrease or increase the production niveau in the study area without modifying the input data. However, if you want to change the production potentials only for sub-regions you have to create a new input file (see .beast FileGenerator as well as documentations for field crops). Annual changes (typically improvements) can be defined in the form "Yield Changes".
In this form, you find the average base yields of SRC stored in the input data and used for the scenario simulation (look for "(avg. in the region ...)"). You are able to modify the base yields by inserting values different to 100%. The percentage value is applied to each field seperately. Therefore, you are able to decrease or increase the production niveau in the study area without modifying the input data. However, if you want to change the production potentials only for sub-regions you have to create a new input file (see .beast FileGenerator as well as documentations for SRC).
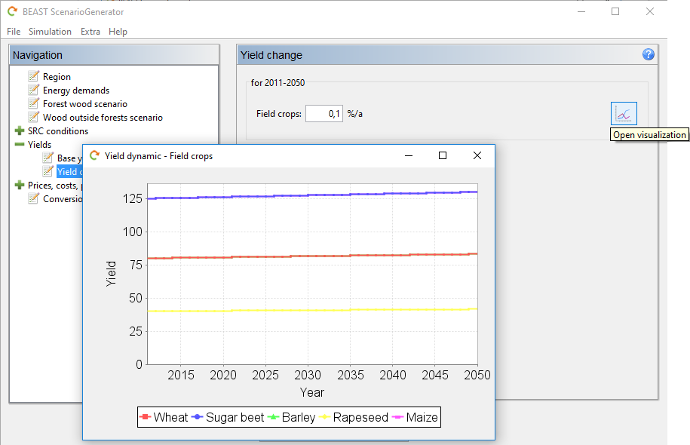
Yield Changes
Here, you can define an annual yield change percentage value due to production and/or crop improvements. Keep in mind that the percentage value is always applied to the (updated) yield value of the previous year.
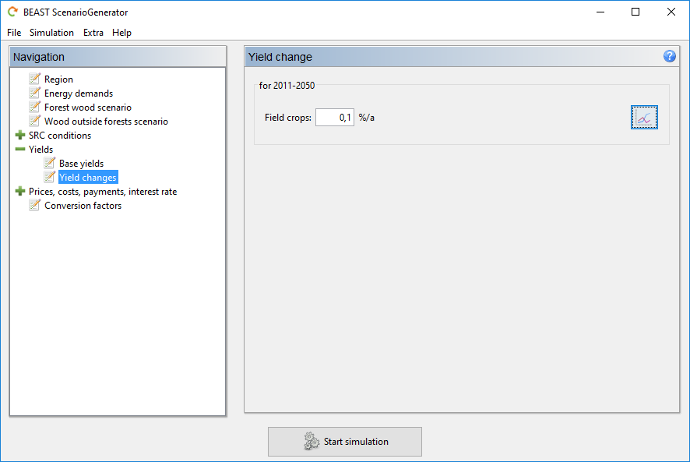
The resulting yield dynamic is visualized by pushing the graph button on the right. As an example, the resulting yield dynamic of the different field crops of the average base yields over all fields is visualized.
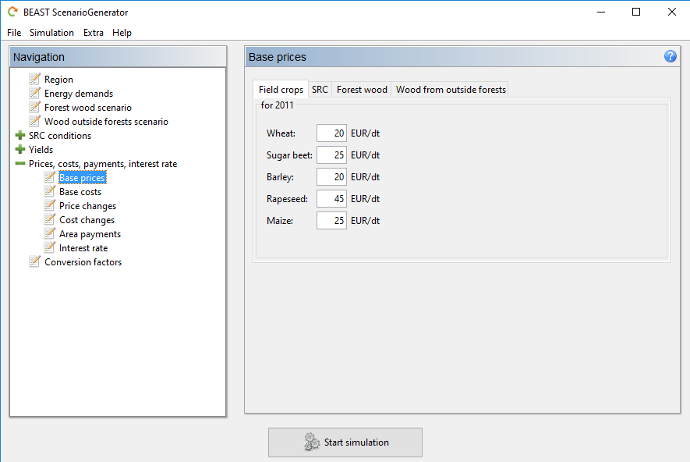
Base Prices
In this forms you can modify the base prices for the different biomass sources. You should be consistent in what kind of prices is used for the different sources (e.g., dry biomass, incl. transportation costs etc.). Annual changes of prices can be defined in the form "Price changes".
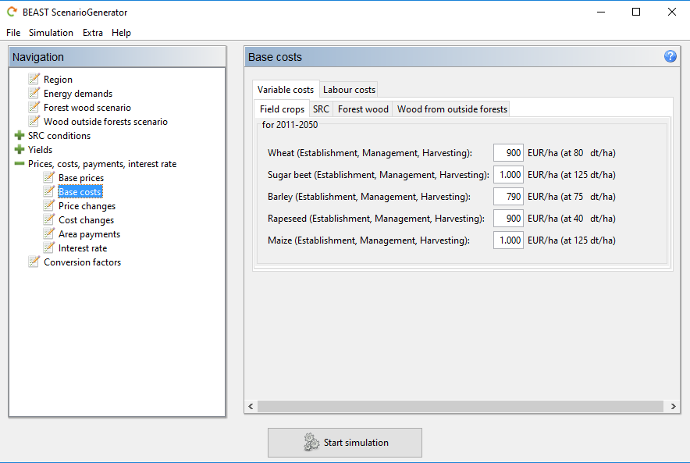
Base Costs
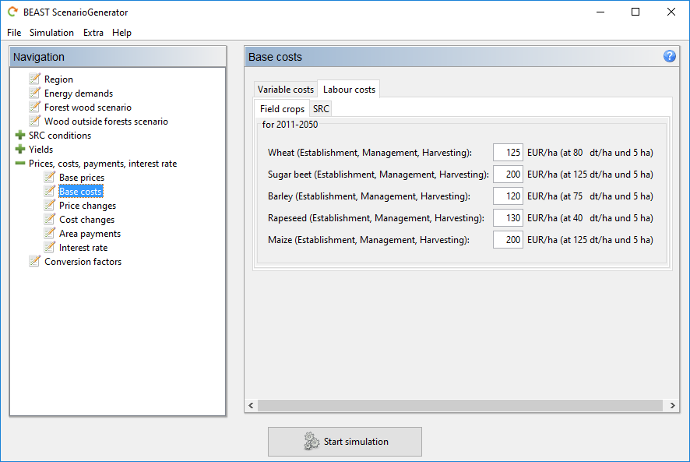
In the form "Base costs" you can modify the costs of biomass production. For all biomass sources you can define variable costs. For field crops and SRC, we assume that the basic variable costs are yield dependent. Therefore, the reference yield per hectare for the variable costs is given (look for "(at ... dt/ha)").
For field crops as well as SRC you can define yield- and area-dependent labour costs explicitly. The reference values for the costs are given (look for "(at ... dt/ha and ... ha)").
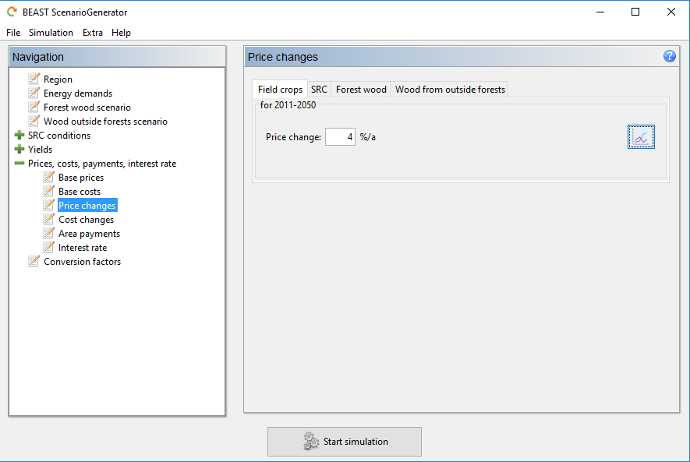
Price Changes
To incorporate the price dynamics of the different products an annual price change percentage value can be defined. This percentage value is applied to the (updated) base price of the previous year.
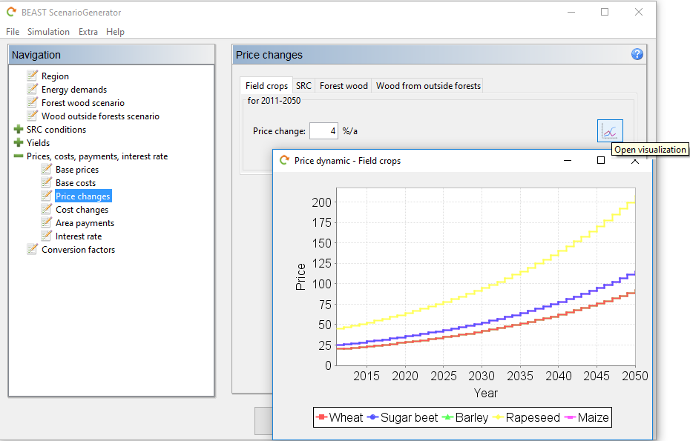
To get an impression of the consequences of a certain price change percentage value you can open a visualization by pushing the graph button on the right. The annual price change is applied to the given base price until the end of the scenario simulation.
Cost Changes
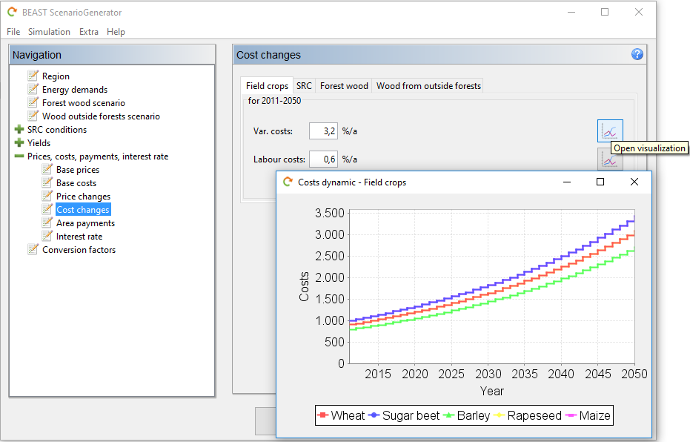
With this form you can define an annual cost change percentage value applied to the base costs, or, in case of field crops and SRC, to variable costs and labour costs. This percentage value is applied to the (updated) base costs of the previous year.
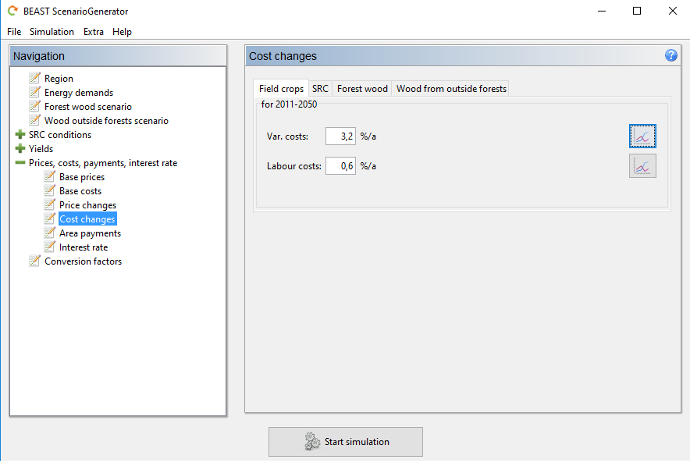
To get an impression of the consequences of a certain price change percentage value you can open a visualization by pushing the graph button on the right. The annual cost change is applied to the given base costs (at the reference values of yield and area) until the end of the scenario simulation.
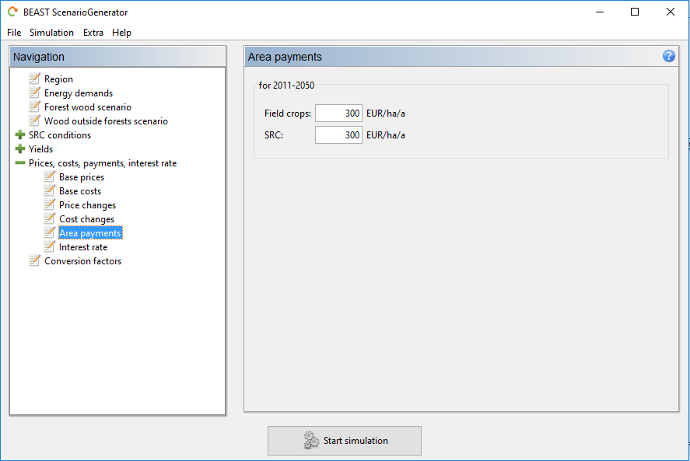
Area Payments
Annual area payments for the different usage options - field crops or SRC - on arable land can be given here. This opens the opportunity to evaluate the effect of different area payments on the economic attracivity of SRC.
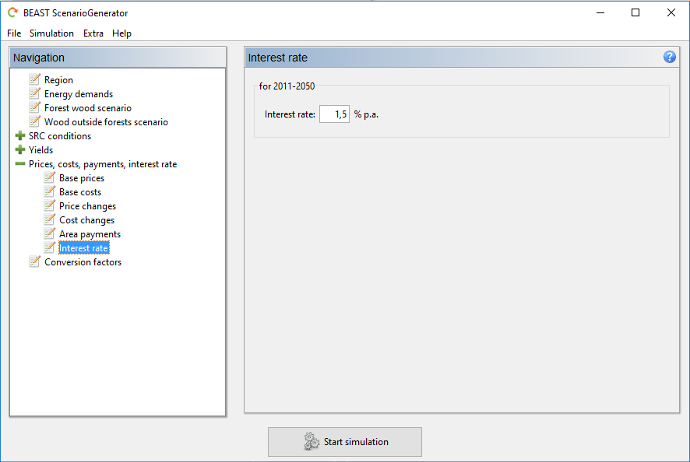
Interest Rate
Economic calculations use an internal interest rate to calculate a mean annual contribution margin (annuity). This interest rate can be modified here.
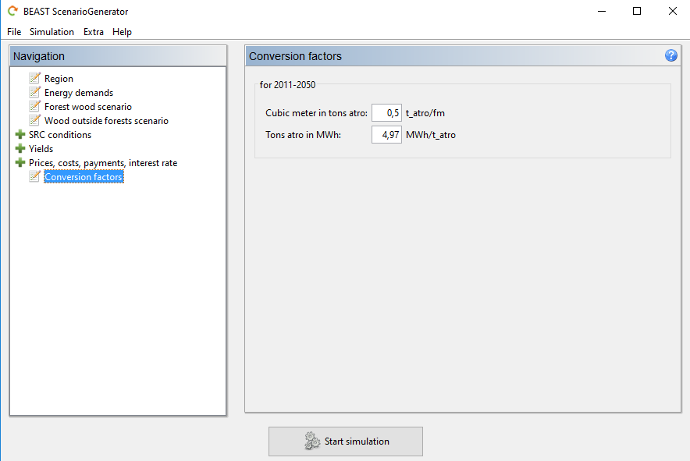
Conversion Factors
In this section, you can change the conversion factors used to transform forest wood volume into dry mass value as well as to convert woody biomass into energy.